Week 1 — Operations and productivity
Thursday, 1 October 2026 · Heizer Ch. 1
ChapterHeizer Ch. 1 — Operations and productivity · eLibrary (university network or VPN)
Morning testnone
Bonus sheetcounts toward Test 1
Productivity is always a ratio, and the interesting question is what goes into the denominator.
Learning goals
- Define operations — inputs → outputs
- Calculate productivity — single-factor, multifactor, growth; always with unit
- Compare measures — per person-hour vs. per euro
- Solve textbook cases — Collins Title, Modern Lumber
- Name the drivers — labor, capital, management
- Model processes with Python — moving day in Colab, checked by hand
Bring
Laptop (Google account) · calculator · pen · phone
Thursday
Morning · 09:00–12:00Concepts: productivity concept · trade-offs in achieving productivity · analyzing how productive a process is
Afternoon · 13:00–15:30Modeling process productivity · analyzing processes by calculating productivity ratios
- Formulas in words: output ÷ input · single-factor · multifactor, in money · growth = (new − old) ÷ old
- Student life → factory (Collins Title, Modern Lumber, Fisher Technologies) → supply chain
- Summary: Key content
Supply chain, level three: a $1.50 bottle of water
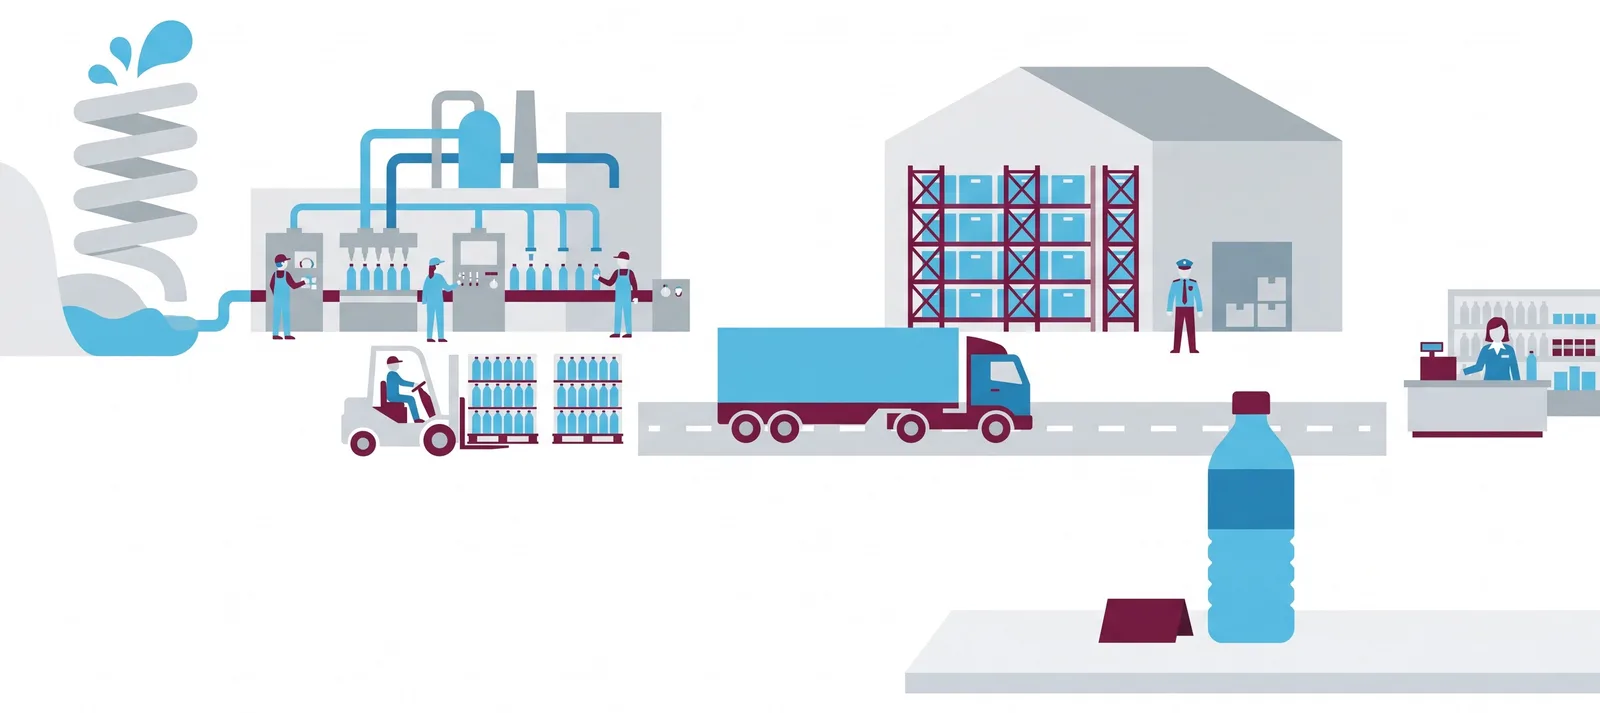
- Water, plastic, label ≈ $0.50 · the price is $1.50 · predict first: what pays for the other dollar?
- Open the bottle animation → (works on a phone) · press Play and watch the cost ledger fill
- Same logic in services: a hotel buys furniture and food, schedules housekeeping, moves supplies
Supply chain complexity: one T-shirt, run backwards
- The full story: Planet Money Makes a T-Shirt → (NPR Planet Money, a joint project with This American Life; five short videos: cotton, machines, people, boxes, you)
Downloads
After class: Test 1 practice sheet.
Optional reading
History of productivity:
- Schmenner, R. W. (2001). Looking ahead by looking back: Swift, even flow in the history of manufacturing. Production and Operations Management, 10(1), 87–96. https://doi.org/10.1111/j.1937-5956.2001.tb00069.x
Key content
Download as text · quiz-me prompt · exercises
Problem
Every service is a small production: inputs (people, equipment, organisation) → output.
Operations = the part of a firm that turns inputs into outputs. Productivity = output ÷ input.
Sentence of the week
Productivity is always a ratio, and the interesting question is what goes into the denominator.
Numerator (output): easy to count. Denominator (input): a choice that decides the answer. No input named → no meaning.
Formulas
| Measure | In words | Unit, e.g. |
|---|---|---|
| Productivity | output ÷ input | guests per person-hour |
| Single-factor | output ÷ one input | crates per labor-hour, units per kWh |
| Multifactor | output ÷ all inputs, in money | titles per dollar, units per euro |
| Growth | (new − old) ÷ old | % |
- Person-hour = labor-hour = one person, one hour
- Multifactor: convert every input to money first (hours + kg + kWh cannot be added)
- Growth: always divide by the old value
- Heizer et al. (2023), Ch. 1: The productivity challenge, Productivity measurement
Student life
- Party, 20 guests: 335 person-minutes = 5.58 person-hours → 20 ÷ 5.58 = 3.58 guests per person-hour; per euro of food: a second, different productivity
- Mia’s moving day: output fixed (100 moving units); inputs vary (van size, crew, pizza) → units per person-hour vs. units per euro can rank the plans differently
Factory: textbook anchors
- Collins Title: 8 titles ÷ 32 labor-hours = 0.25 → new system 14 ÷ 32 = 0.4375, +75 %; multifactor 8 ÷ 1,040 $ = 0.0077 → 14 ÷ 1,440 $ = 0.0097, +26 %. Same change, two measures, two gains
- Modern Lumber (Solved Problems 1.1, 1.2): 240 crates ÷ 300 labor-hours = 0.800 → 260 ÷ 308 = 0.844, +5.5 %; multifactor 240 ÷ 4,500 $ = 0.0533 → 260 ÷ 4,580 $ = 0.0568, +6.4 %
- Fisher Technologies (Table 1.1): contribution 10,500 $; sales +50 % → 18,000 $; finance costs −50 % → 12,750 $; production costs −20 % → 22,500 $. Operations = strongest lever
Supply chain
Output = products delivered to customers; input = what all firms spend (€) or emit (t CO₂). One firm’s gain can be the chain’s loss; € and CO₂ can point in opposite directions.
Productivity variables
- Labor — people, skills, health
- Capital — equipment, tools
- Management — organisation, technology, knowledge (find in the chapter which one contributes most to growth)
- Services: output hard to count; quality escapes the count
Typical errors
- No unit (“3.6” says nothing)
- Adding hours, kg and kWh — convert to money first
- Growth divided by the new value (43 % instead of +75 %)
- Faster ≠ more productive (more people can lower output per person-hour)
- Ranking ratios with different denominators against each other
Practice items (no keys)
- Copy shop: 1,200 pages, 2 people × 6 h → new printer: 1,500 pages, same staff. Pages per labor-hour before/after? Growth in %?
- Food truck: 240 wraps; 2 workers × 10 h × 15 €, ingredients 360 €, fuel and gas 40 €, rent 100 €. Wraps per euro? Which input to cut first, and why?
- Cargo bike 80 parcels/day vs. van 120 parcels/day: two denominators favouring the bike, one favouring the van.
Slides
After class.